Recirculating Aquaculture Systems - Comparison To Net Pen

Information about recirculating aquaculture systems and net pen systems has been excerpted from a Conservation Fund / SINTEF presentation whose authors include: Trod W. Rosten, Kristian Henriksen, Erik Skontorp Hognes, Brian Vinci and Steve Summerfelt. We include a direct link to the complete presentation below.
Model Land-based Recirculating Aquaculture Systems farm (32 million US $ )
Invested equipment:
- 40,000 m3 of rearing tank volume
- 25,500 m2 of building area
- 2,500 m2 processing facility
- 885 m3/min of pumped RAS flow
- Pumps and Piping
- Screen filters
- Biofilters
- Gas Conditioning Filters
- 1.08 – 1.26 kg feed per m3 supply water
- Feeding Systems
- Backup Generators
Model Net Pen farm (12,3 million US $):
- Two production sites, each with six net pen cages.≈587,000 m3 net-volume
- 120,000 m2 area footprint visible at sea
- ≈179,000 m2 area footprint incl. no thoroughfare zone
- ≈463,000 m2 area footprint incl. no fishing zone
Invested equipment:
- 3 licences
- 12 Floating rings (157m Ø)
- 24 nets (25 m deep)
- 2 mooring systems
- 2 boats
- 2 feed barges (150 Mtons)
- 12 camera systems
- 12 feed distributors
- 12 power systems

Model Land-based Recirculating Aquaculture Systems Farm
- One production site for all life-stages
- Four cohorts per year
- Growth based on thermal growth coefficients from Freshwater
- Institute growout trials, adjusted down by 10%:
- 1.1 for Fry
- 1.25 for Smolt
- 1.8 for Pre-growout
- 2.2 for Growout
- Mortality per generation 16%
Feed conversion ratios:
- 0.75 for Fry
- 0.90 for Smolt
- 1.0 for Pre-Growout
- 1.1 for Growout
- Overall Feed to Whole Fish Produced (kg/kg): 1.09
Rearing Density
- 80 kg/m3 maximum
Harvesting:
- Time from first feeding to first harvest: 21 months
- Harvest every week of the year
- Each cohort harvested over 13 weeks
- One grisle harvest at ~1.2 kg for 50% of males
- Harvest in total: 3947 M.tons LWE, 3300 M.tons HOG (5% purge loss / 12% HOG loss)
- Initial harvest weight (whole fish): 4.5 kg
- Average harvest weight (whole fish): 5.1 kg
- No downtime in the bio-plan

Model Net Pen farm:
- 2 production sites & 3 licences of 780 M.tons of maximum total biomass at sea.
- Two transfers of smolts to sea annually, to one site
- S1 at 1st of April, 100 grams, 520' smolts in three cages
- S0 1st of August, 75 grams, 520' smolts in three cages
- Growth based on the Skretting table, Specific Growth Rate
- (SGR), adjusted down by 12 %.
- Mortality per generation approximately 16,1 % (average in
- Mid-Norway in 2011) (Norwegian Food Safety Authority 2011).
- Economic feed conversion ratio: 1,27 (average in Norway over the last ten years) (Directorate of Fisheries 2013).
Rearing Density
- 25 kg/m3 maximum
Harvesting:
- Time from first feeding to first harvest: 24 - 31 months
- Time at sea before first harvest: 16 months
- Harvest 8 months of the year
- Harvest S1 from July to October
- Harvest S0 from November to February
- Harvest in total: 3 975 M.tons LWE, 3 299 M.tons HOG
- (5 % purge loss /12 % HOG loss)
- Average harvest weight (whole fish) : 4,5 kg
- Two months of fallowing between production cycles
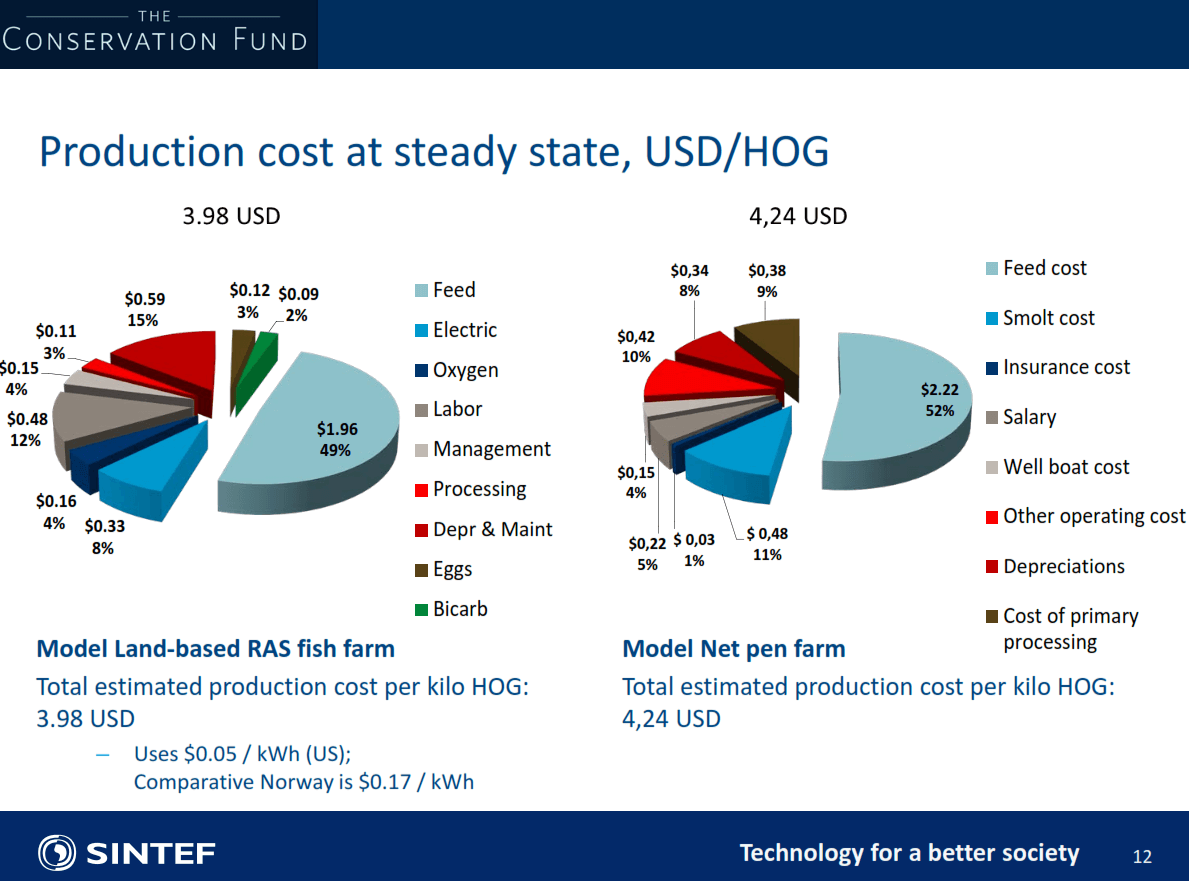
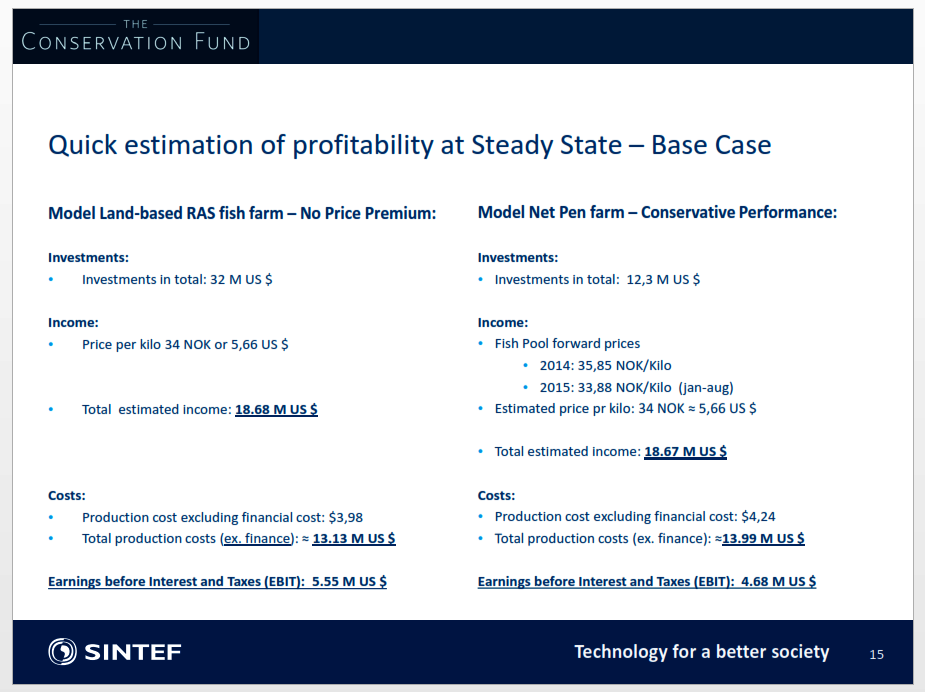
Recirculating Aquaculture Systems Profitability
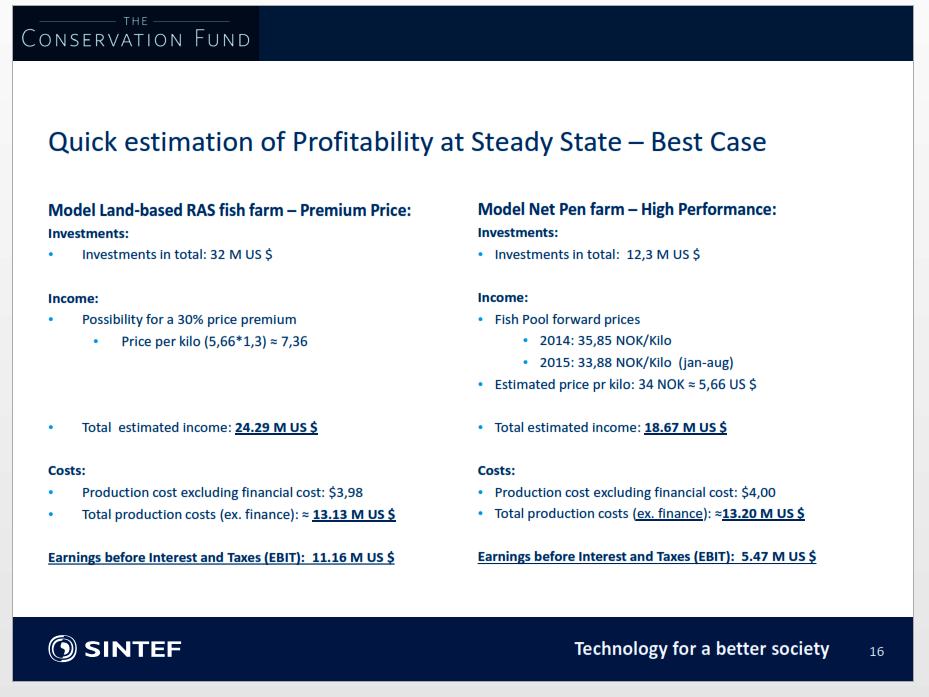
Complete Presentation (Workshop #6)
- Palom Front Page ›
- Recirculating Aquaculture Systems Pros and Cons ›
- Recirculating Aquaculture Systems Comparisons